Vericast splash image

Vericast

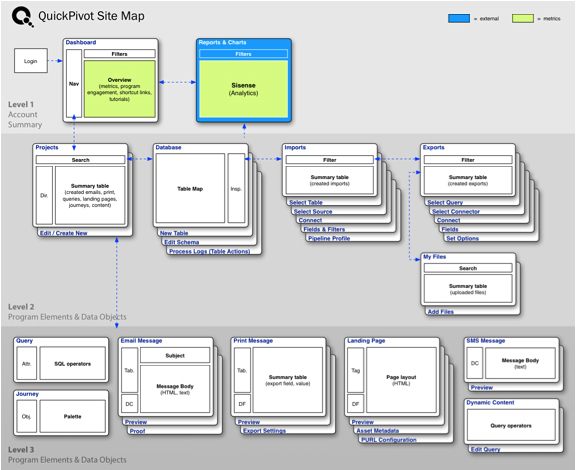
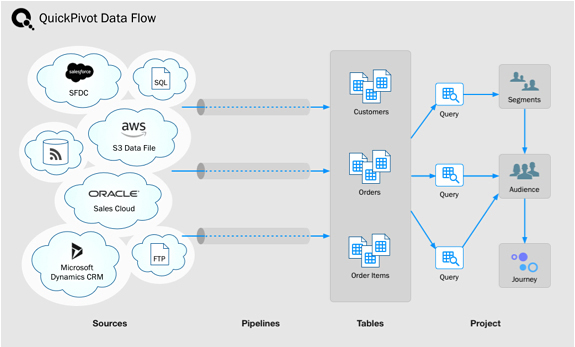
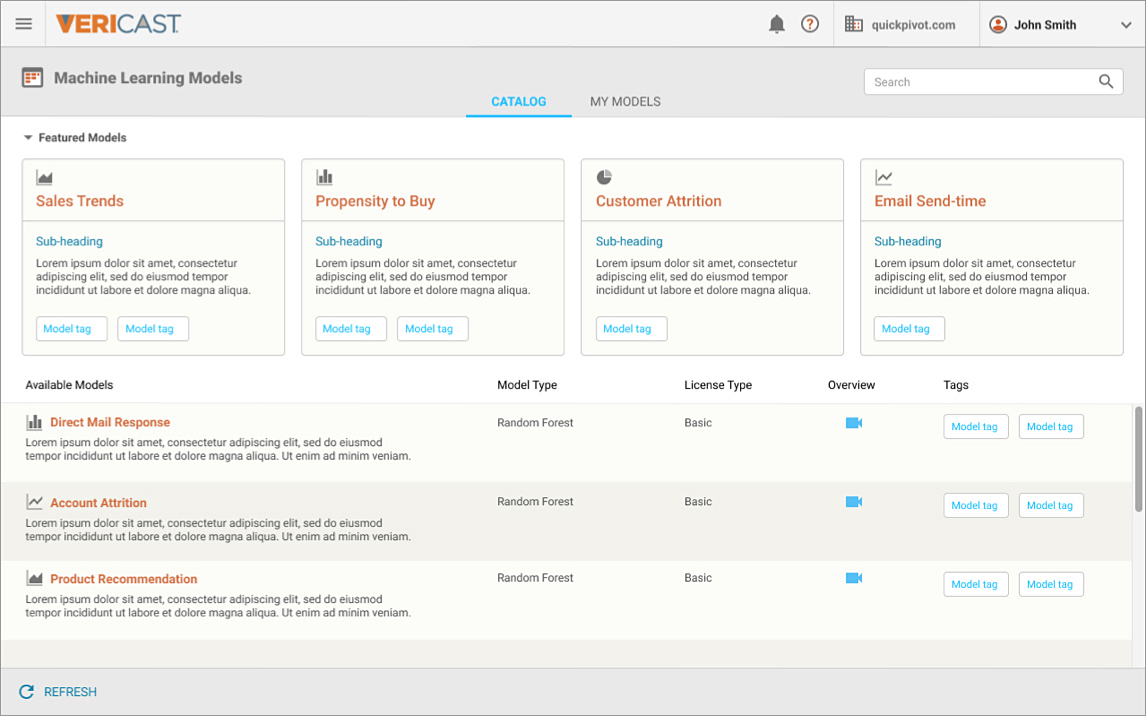
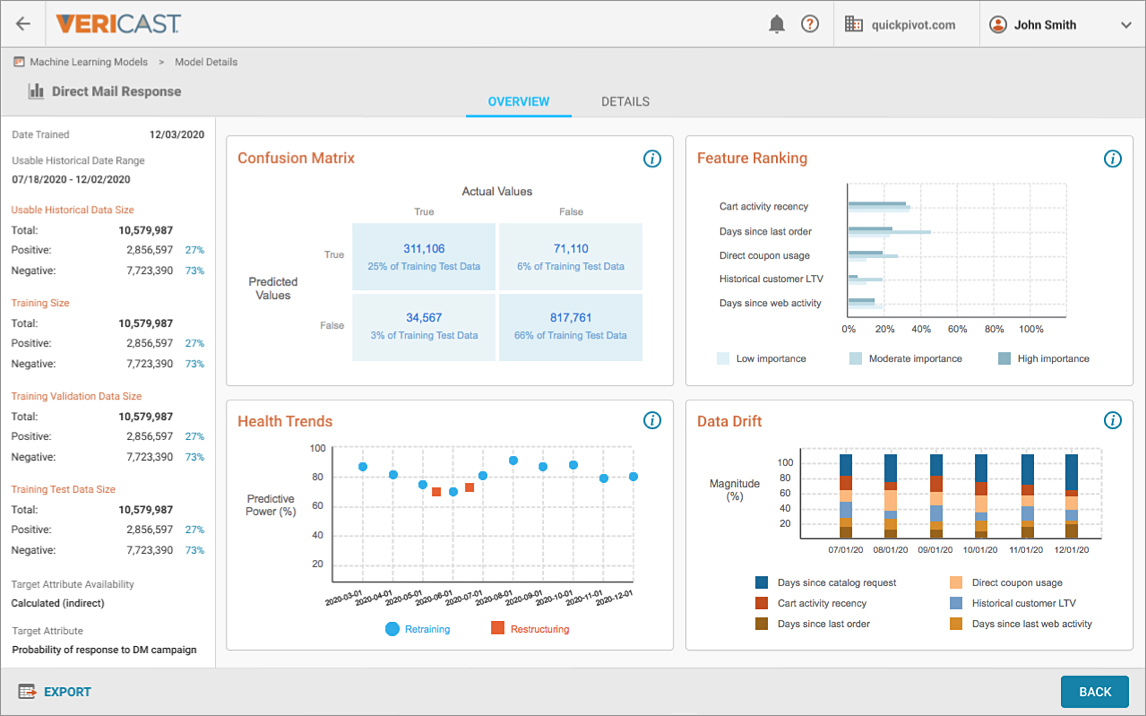
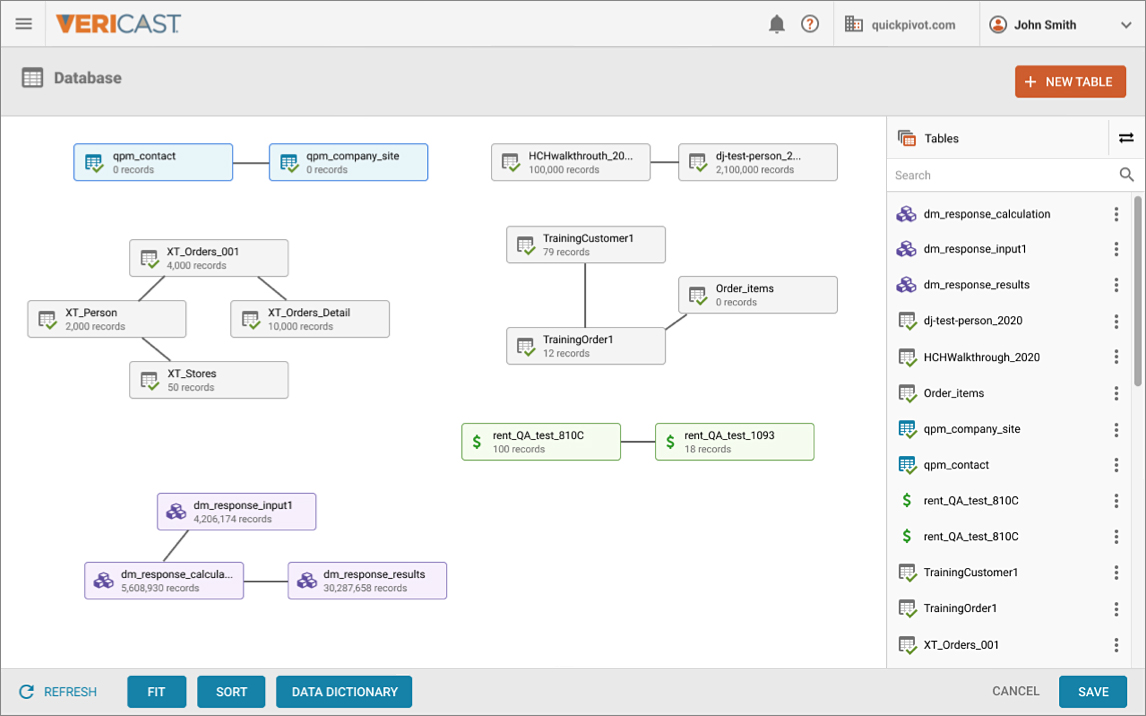
Vericast's QuickPivot customer data platform is used by mid-market retailers (such as IKEA, Orvis, and the NHL) to optimize consumer engagement and ROI measurement. QuickPivot leverages the power of machine learning so that marketing professionals can more effectively segment large target audiences, predict purchase behaviors, and identify deep product connections. As one of two Senior UX Designers, I worked on the data management and analytics part of the platform, and was responsible for user research, UI design, and data science visualizations.

Vericast QuickPivot site map

A diagram of the QuickPivot platform's site map that illustrates navigation, page depth, and where analytics are summarized.

Vericast QuickPivot data flow

This data flow diagram illustrates the importing of external data sources into the QuickPivot platform, data table building, and query execution to generate segments and audiences for the engagement journey.

Vericast machine learning models home

The QuickPivot platform's Machine Learning Models home page allows users to browse and preview available packaged models.

Vericast machine learning model details

When users select a packaged model framework from the Machine Learning home page, that model's details page is displayed. Data visualizations summarize the model's performance, predictive power, and health.

Vericast data tables

The Database page is a visual mapping of the data tables that have been generated from imported data pipelines.